
Levees provide for the safe conveyance of water and reduce damage caused by floodwaters.
Levees reduce flood risk but do not eliminate it.
It is essential to recognize that levees cannot protect against all possible levels of flooding and to distinguish between:
- flood damage prevention and protection that is an actually unachievable goal;
- flood risk reduction that is a desirable and achievable goal.
Levees are designed and constructed to withstand flooding of a specific magnitude. For example, a levee designed to exclude a 1-in-200-year flood may be overtopped by a larger flood.
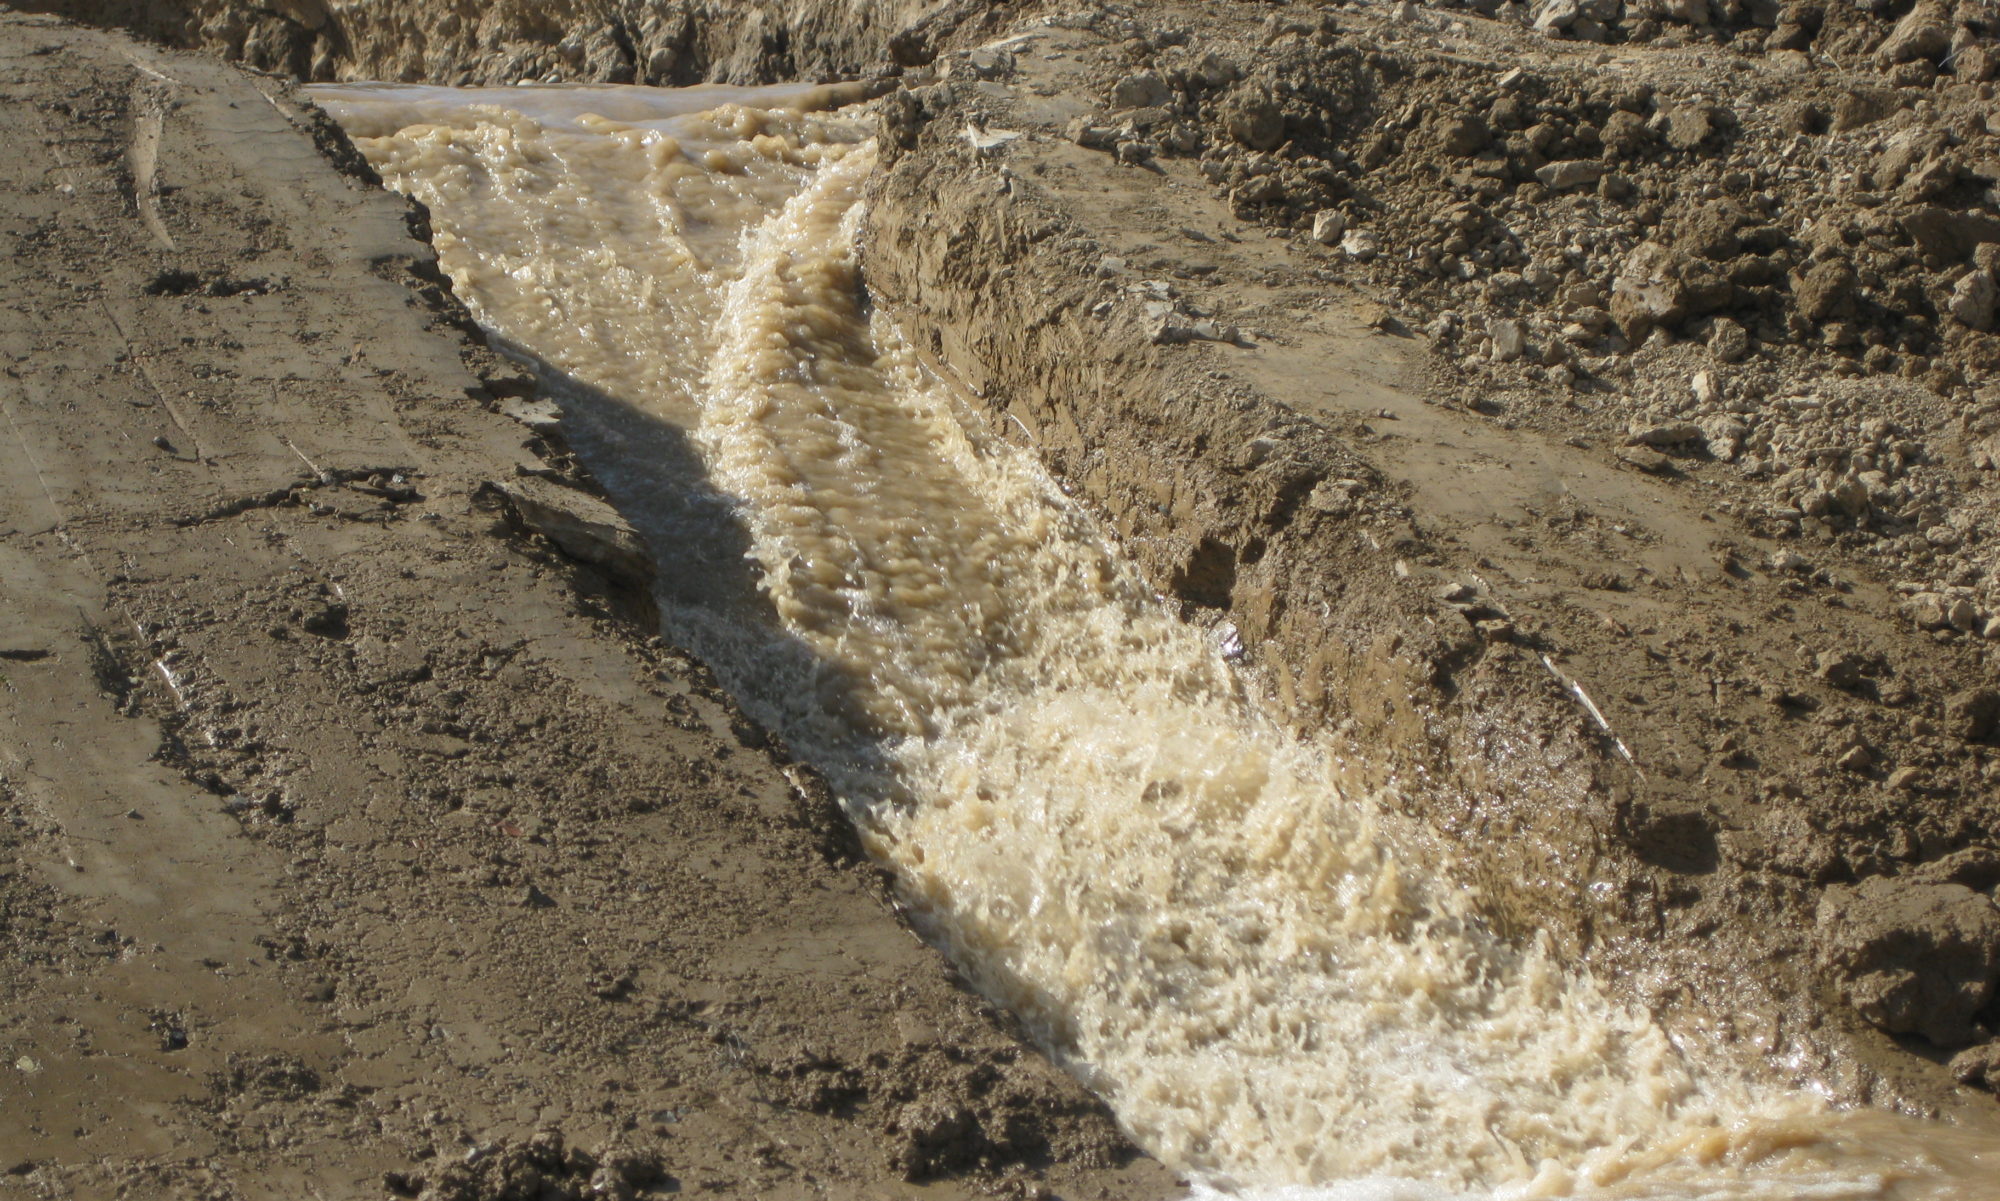
Riverine flooding is the result of heavy or prolonged rainfall or snowmelt. Moreover, in urban areas, flooding can be caused by poor drainage. In coastal areas subject to tidal effects, flooding can result from wind-driven and prolonged high tides, poor drainage, storm surges with waves and tsunamis.
Flood characteristics, useful in analyzing the flood threat, are:
- FLOOD DEPTH AND ELEVATION. Flood depth is measured from the floodwater surface to the adjacent ground level, while flood elevation is measured against an established standard datum.
Floodwater can impose hydrostatic forces on buildings which result from the static mass of water acting on any point where floodwater contacts a structure. They are equal in all directions; increase linearly as the depth of water increases and always act normally to the surfaces on which they are applied. Water depths greater than 3 feet can often create hydrostatic forces with enough load to cause structural damage (FEMA).
Determining the expected flood depth at a site is critical for the overall determination of flood-related hazards.
Determining the potential depth of flooding for certain flood frequencies is a critical step because it is often the primary factor in evaluating the potential for flood damage.
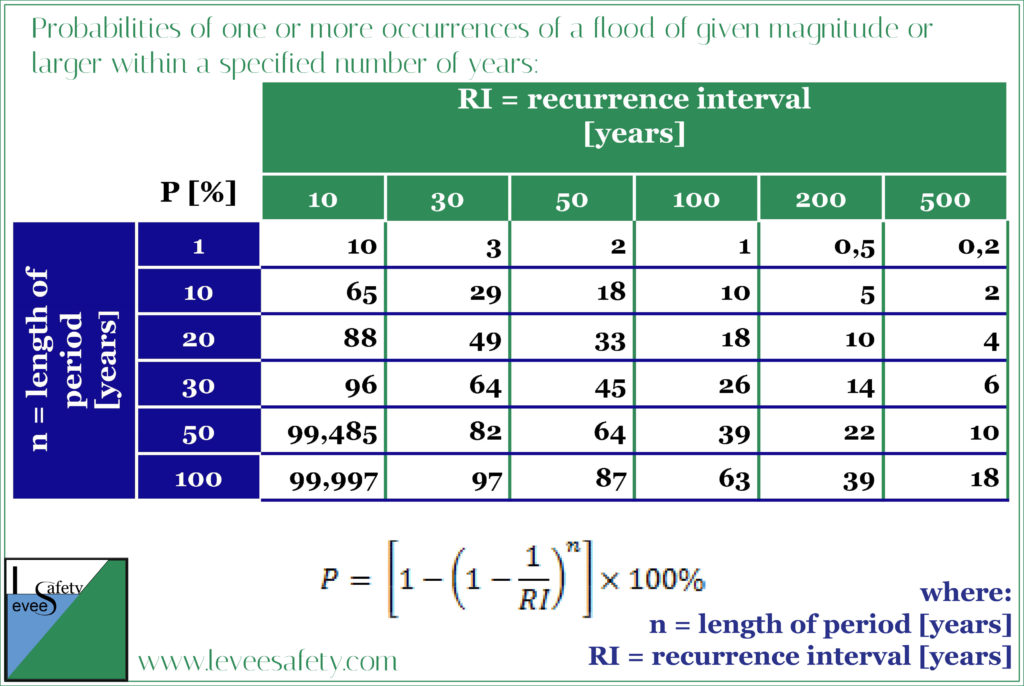
- FLOOD FREQUENCY. Flood frequency analyses define the probability that a flood of a specific size will be equaled or exceeded in any given year. Therefore, a flood elevation with a 1-percent-annual-chance of being equaled or exceeded in any given year is referred to as the “100-year flood.” Flood probabilities are useful in evaluating the retrofitting measures. The probabilities, expressed in percentages, associated with one or more occurrences of a flood of given magnitude or larger within a specified number of years are reported in the following table.
- FLOOD FLOW VELOCITY. It is the speed at which floodwater moves. Riverine floodwater velocity depends primarily on the slope and roughness of the ground surface. In coastal areas, wind speed also influences flow velocity. Hydrodynamic forces result from the velocity flow of water against or around a structure. As floodwater velocity increases, hydrodynamic forces caused by moving water are added to the hydrostatic forces from the depth of still water, increasing the possibility of damages. Flowing water often causes erosion and scour. Greater velocities can quickly erode or scour.
- RATES OF RISE AND FALL. In areas of steep topography or with a small drainage area, floodwater can rise very quickly with little or no warning: this condition is known as flash flooding. High velocities usually accompany these floods. High rates of floodwater rise and fall may also lead to increased hydrostatic pressures due to the fact that the water level inside the structure rises and falls more slowly than the level outside.
- FLOOD DURATION. It is related to rates of rise and fall. A detailed hydrograph can provide information on duration of flooding. If such information is not available, one potential solution is to check similarly sized drainage basins in neighboring areas to see if historical data exists. Long-duration floods, due to the prolonged exposure to floodwater, are more likely to cause greater damages (increased chance of seepage and failure).
Debris impact is a flood hazard directly related to flood characteristics (depth, velocity, rate of rise and fall) with respect to upstream site characteristics. Rising floodwater can dislodge objects of all types and sizes and high-velocity and flash floodwater may transport the debris downstream and hazard any object that intersects its path.
Base flood is defined as the flood having a 1-percent chance of being equaled or exceeded in any given year.
Base flood elevation (BFE) is the elevation to which floodwaters rise during a base flood.
Design flood elevation (DFE) refers to the locally adopted regulatory flood elevation. Typically, the DFE is the BFE plus any freeboard adopted. Freeboard means a factor of safety usually expressed in feet above a flood level. It tends to compensate for the many unknown factors that could contribute to flood heights greater than the height calculated for a selected size flood and floodway conditions. The DFE is always equal to or greater than the BFE and includes wave effects.
The flood protection elevation (or flood protection level) is equal to the DFE.
d = FE – GS
where:
d = flood depth
FE = flood elevation for a specific flood frequency
GS = lowest ground surface elevation adjacent to a structure
DFE = FE + f
DFE = design flood elevation
f = freeboard (factor of safety); typically f >= 1 ft.
Flood studies present flood elevations of varying frequency, areas inundated by the various magnitudes of flooding and floodway boundaries. This information, presented on maps and based on detailed study and analysis, including historic meteorological, hydrologic and hydraulic data, may be used to determine floodplain limits, flood depth, flood elevation and flood frequency.
Discharges are determined for various locations and flood frequencies along the stream. Flood profiles depict various flood frequency and channel bottom elevations along each studied stream. For example, discharges and water-surface elevations for the 10-, 50-, 100- and 500-year floods (which have annual exceedance probabilities of 10, 2, 1, and 0.2 %, respectively) are presented.
The coastal analysis includes the determination of the storm surge stillwater elevations (for the 10-, 2-, 1- and 0.2-%-chance floods) that represent the potential flood elevations from tropical or extra-tropical storms, tsunamis or a combination of any of these events. The increased flood hazards from wave heights and wave runup are taken in account and added to the stillwater elevations to yield the regulatory base flood elevation.